

Every town holds a story that only becomes visible when you put it on paper. The row of cottages built for mill workers. The field that was a market long before it was a car park. The school that moved twice in forty years. A thematic map follows one of those threads across the ground, so that a reader standing in the square can see something they walked past this morning without noticing.
You do not need a large budget or a specialist on call. You need a clear question, a modest pile of well-sourced facts, and the discipline to leave things out. What follows is the working method a small history group can follow from a vague idea to a printed sheet that people actually use.
Start with a question, not with a map
"The history of the town" is not a theme; it is an archive. A thematic map works when it answers a single question that can be answered by putting things on the ground. Where did the shoemaking trade cluster between 1880 and 1930? Which wells served the village before the mains arrived? How did the route of the old coach road bend around the marsh?
Write your question on a sheet of paper and keep it where you work. Every fact you collect later gets judged against it. Anything that does not help answer the question belongs in the notes, not on the map.
Strong community themes tend to share three qualities:
- A subject — a trade, a building type, a land use, a route, a family, or a recurring hazard such as flooding.
- A defined place — a parish, an old ward, a single street, a farm, a valley.
- A period — even a loose one, such as "before the estate was built" or "1900 to 1965".
Vague themes produce vague maps. "Industry in the area" gives you a scatter of dots with no argument. "Where the tanning trade stood in 1890, and what happened to those sites" gives you a map with a point of view.
Fix the frame: boundary, dates, and scale
Decide early where the map stops. The most defensible boundary is usually one that already exists in the records: a parish, a municipal ward, a title deed, a school catchment. If you invent a boundary, say so in a note, because readers will otherwise assume it means something official.
Dates need the same treatment. A thematic map with a stated period is a historical document; the same map without one is a rumour. If your evidence is uneven — dense for the 1890s, thin for the 1950s — show that honestly rather than smoothing it away.
Then choose your scale. Most local projects settle into one of three sizes: a street-level map for a single terrace or market square, a town map for a parish or small town, and a district map for a rural area with several settlements. Trying to cover all three on one sheet is how maps become unreadable.
Gather the evidence, and record where it came from
Local data is rarely tidy. It arrives in a handful of formats and from a handful of places, and much of the work is reshaping it into something a map can use.
Where local evidence usually lives
County record offices and local studies libraries hold tithe and enclosure maps, early Ordnance Survey editions, trade directories, newspapers on microfilm, and poor law records. Parish registers and cemetery inscriptions supply names and dates. Planning departments keep applications describing buildings that no longer stand. Photograph collections, postcards and the memories of long-standing residents cover the rest. Oral testimony is the most fragile source and often the most vivid: record it, date it, and note who told you.
Keep a source log from the first day
Every feature you intend to map should carry five things: what it is, where it was, when it existed, where you found it, and how confident you are. A single spreadsheet column for "source" and another for "confidence" will save you weeks later, when someone asks why the forge is marked on the corner and not across the road. Where two sources disagree, keep both. A note such as "directory 1898; not shown on the 1905 map" is more useful than a false certainty.
Turn the notes into a table
One row per feature, one column per attribute. Practical columns include a name, a category, a start and end date, a location written as coordinates or a grid reference, a source, and a short note. Keep names consistent — "Mill Lane" and "Mill St" in the same column will split one street into two on your legend. If you have no coordinates, an address plus a mark on a printout works perfectly well for a town-scale map.
Decide what belongs on the map, and what does not
Before you open any software, sort your features by shape. Points suit workshops, wells, milestones and individual buildings. Lines suit routes, boundaries, tramways and streams. Areas suit fields, estates, flood extents and cleared sites. Mixing all three is fine, but each needs its own visual language in the legend.
Then cut the categories down. Three to six is plenty for a community map; ten is a database wearing a hat. If a category has one entry, ask whether it earns a symbol or whether a label would do the job.
Think about the background, too. A faint modern street layout helps readers place themselves, and a pale historic base map helps them see change. Check the terms of use before you reproduce any published map, and credit it clearly on the sheet.
Design so a stranger can read it
Design is mostly a matter of what you refuse to include. A local map is often read at arm's length, pinned to a village hall wall, or photocopied for a newsletter, so legibility beats elegance every time.
Title, legend, and small print
The title should state the theme, the place and the period: "Shoemakers' workshops in Ashwell, 1880–1930". Not "Ashwell map". The legend goes where the eye falls naturally, usually lower left or lower right, and should use the same wording as your data table. Add a scale bar, a north arrow if the map is not oriented north, a credit line for sources, and the date you compiled it.
Colour, symbols and labels
Use distinct hues for separate categories and a single hue in varying strengths for quantities. Print a test copy in greyscale — many local publications still are — and check that your categories remain distinguishable. Labels should be few and placed with care; a thin white outline behind the text keeps a name readable over a busy base. Then check your smallest text at final printed size, not on screen.
A quick checklist before you call the design finished:
- Can a reader find the title, the legend and the scale bar without hunting?
- Does every symbol on the map appear in the legend, and every legend entry appear on the map?
- Are dates and sources stated plainly, including gaps in the evidence?
- Does it still work printed at A4 in black and white?
A simple workflow from sketch to print
- Sketch the layout by hand on paper at the size you intend to print. It is faster to move a box with a pencil than with a mouse.
- Build and clean the data table before drawing anything.
- Draft the map in whatever tool you have — a GIS package, an illustration program, or a careful hand-drawn sheet scanned at high resolution.
- Print a proof at final size and look at it from a metre away, then from reading distance.
- Ask two people who know nothing about the project to find three specific features. Their hesitation tells you what to fix.
Before you publish the map
Keep the data file, not just the finished image. Local maps get revised — a new photograph surfaces, a date is corrected, a building is demolished — and a tidy spreadsheet means the next edition takes an afternoon rather than a month. Deposit a copy of the finished map with the local library, the record office or the historical society, and note in the file which sources you consulted and which you could not access.
Print at two sizes if you can: A3 for display boards and A4 for handouts and newsletters. Include a short source note and an invitation for corrections, with a contact route that will still work in five years. Then take the map out and test it on the ground. Standing on the corner where the forge once stood, with your own map in hand, is the quickest way to find the error you would otherwise have published.
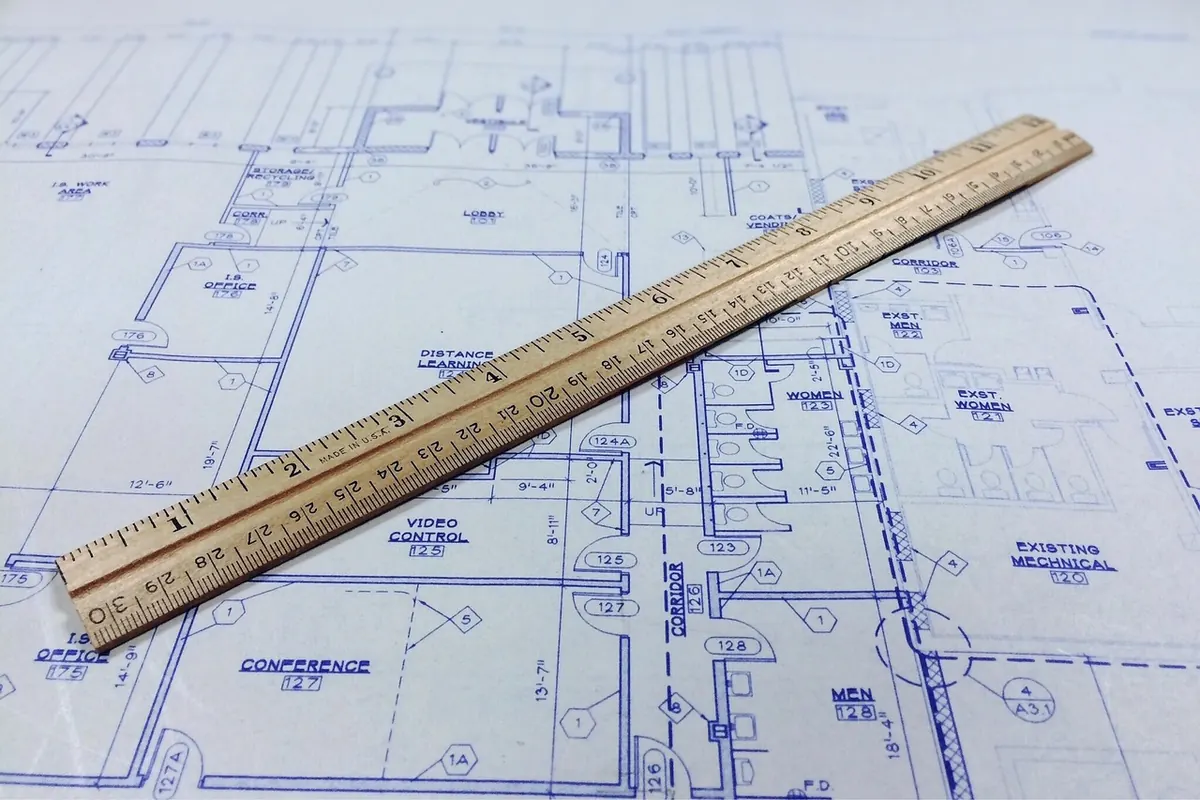
Photo: DariuszSankowski / Pixabay