
Long before a tower was something you climbed for a view, it was something a map could not afford to omit. A tower on a headland told a ship's master where the reef began. A tower on a ridge told a surveyor where the next triangle ended. A tower with a fire lit on top told a whole province that an army was coming. Cartographers did not draw towers out of decorative habit; they drew them because people needed to find them, reach them, and see from one to the next. The history of towers on maps is, in a quiet way, a history of how landscape became information.
Before the map: towers as fixed points in a moving world
Most medieval and early modern travel was coastal. Ships hugged shorelines, and pilots recognised places by silhouette rather than by coordinates. A squat round tower on a promontory was a gift: unmistakable in haze, visible from a distance, and hard to confuse with a rock. Portolan charts and sailing directions reflect this practical obsession. They list headlands, shoals, and towers together, because in use they belonged together.
The same logic held inland. A tower gave a traveller something to aim at across a plain or a forest, and roads adjusted themselves accordingly. Settlements grew at the foot of towers, ferries crossed where a tower could be seen from both banks, and market routes bent toward the places where a tower offered shelter. When you look at an old map and find a village called Torre, Tour, or Tuirm sitting where two roads meet, you are often looking at the fossil of a landmark that organised movement centuries earlier.
From picture to symbol: how a tower becomes cartography
The earliest tower on a map is usually a drawing. A little crenellated cylinder, perhaps with a flag, placed in profile on the hill. It is charming, and it is also precise in its own way: the artist tells you the thing is tall, built, and worth noticing. What it does not tell you is exactly where it stands, or how far it is from the next tower along the coast.
As surveying improved, the tower shrank. It became a point symbol: a small circle, a square, a triangle with a dot in it, or in tourist cartography a tiny pictogram of a keep. This is not a loss of information but a change of purpose. The map no longer says look, a tower; it says there is a tower at this position, and here is what surrounds it. The tower becomes a coordinate with a story attached.
Reading the three common tower marks
- Historic or ruined tower: often a hollow outline or a symbol with an annotation such as "Tower (ruin)". Position is usually reliable; condition is not.
- Trig point or survey station: a triangle, sometimes with a dot, sometimes with a height figure. It marks a measured point, which may or may not be a tower.
- Viewing tower or lookout: a pictogram in leisure mapping. It tells you the structure is accessible, which is a very different claim from "a tower exists here".
Defence: towers that drew lines across the map
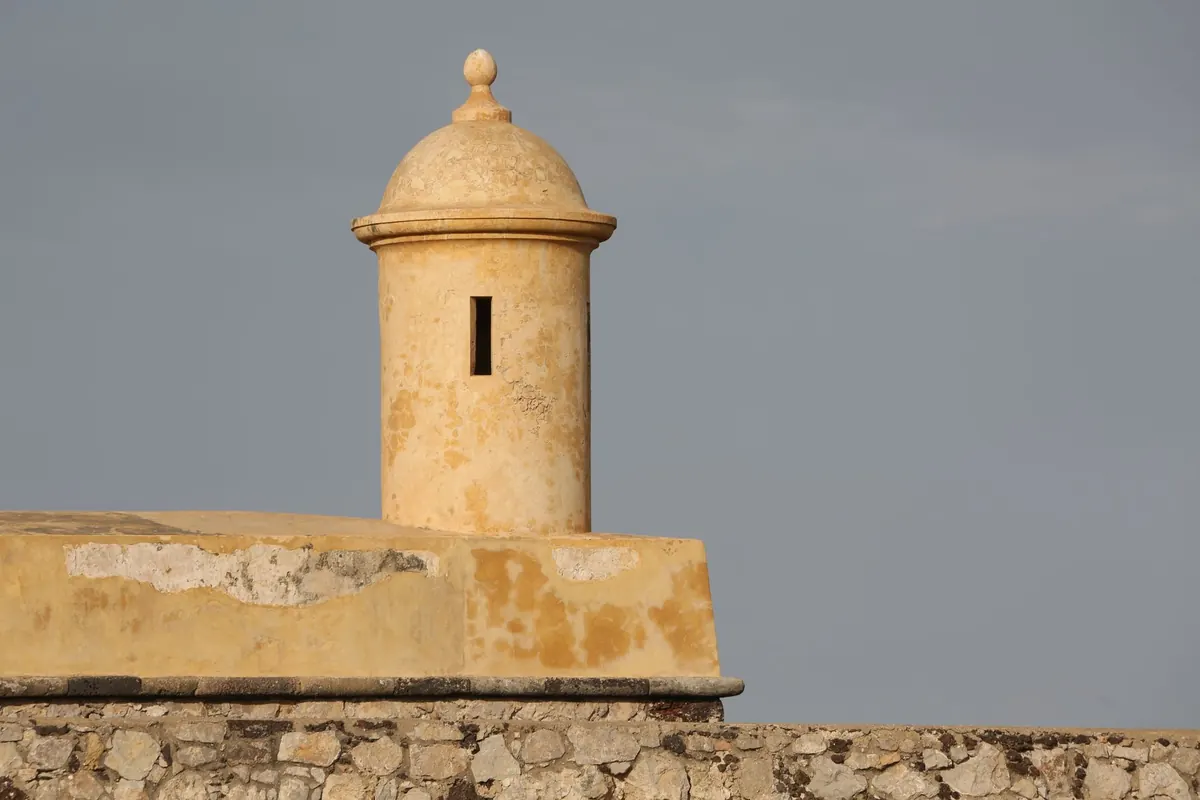
The moment towers were built in series, they stopped being isolated dots and started behaving like a system — and systems are what maps are good at. Along the Ligurian and Corsican coasts, Genoese watchtowers were erected from the sixteenth century onward in a chain meant to pass warning from one to the next. Along the Andalusian shore, Spanish coastal towers did much the same, watching for sails that did not belong. Britain and other powers built low round Martello towers during the Napoleonic wars, designed to resist artillery and to hold a stretch of beach.
On a map, that chain is legible even today. Plot the towers along a coast and you will see they are rarely evenly spaced. They cluster where landing is easy, thin out where cliffs do the work for them, and sit almost always within sight of a neighbour. That spacing is a document. It tells you what the builders feared and where the sea was kindest to an invader.
If two towers on the same map sheet seem oddly close together, check the edition date before assuming a drafting error: chains were rebuilt, abandoned, and re-sited, and a map may record two generations of defence at once.
Signals: when the map became a schedule
Fire and smoke beacons were ancient, but the optical telegraph made towers into infrastructure. From the 1790s, French semaphore lines used high ground, church towers, and purpose-built stations to relay coded signals across whole countries with a speed no rider could match. Similar ideas appeared elsewhere and in other centuries: beacon towers along the Great Wall, beacon mounds on Korean headlands, signal stations on Mediterranean islands.
For cartography, the important consequence was that a tower's value depended on intervisibility — whether you could see the next one. That is a property of terrain, not of architecture. Mapmakers who understood this began to treat towers as nodes in a network, and the network as a feature worth depicting: lines of sight crossing valleys, stations placed on the exact crest rather than the convenient summit. When you see a signal station marked on a ridge with nothing else around it, you are looking at a deliberate choice made with a sightline in mind.
Survey: the tower as instrument
Triangulation gave towers a second career. Church towers, castle keeps, and purpose-built beacons were durable, conspicuous, and already in the right places — on high points with long views. Surveyors adopted them as stations, and in Britain the familiar concrete trig pillar only arrived in the 1930s, long after the first triangulation had been carried out largely from steeples and tower roofs.
This is why the tower symbol and the trig point symbol so often sit on top of one another on older sheets, and why a modern map may show a height figure beside a tower with no explanation. The number is a survey legacy. Someone once stood on that roof with an instrument and measured an angle that fixed the shape of everything around it.
How to read a tower on a map today
Treat the symbol as a question, not an answer. A few habits turn a dot on a sheet into usable local knowledge:
- Check the scale. At 1:50,000, the symbol may indicate the general area; at 1:25,000 it usually marks the building itself.
- Read the name. Torre, Torri, Tour, Turn, Kulla, Torreta, Tŵr — a place-name is often the only surviving record of a structure that has vanished.
- Follow the contours. Towers are sited for views. If the symbol is not on a shoulder or summit, ask why — a harbour entrance, a ford, or a pass usually explains it.
- Compare editions. A tower on a 1950s sheet and a hollow outline on a current one tells you about demolition, not about mapping error.
- Look at the neighbours. Two or three towers in a line are a chain, and a chain has a direction: usually toward whatever was worth warning.
A short practical exercise
Pick a stretch of coast you know and mark every tower, signal station, and trig point on it. Then draw straight lines between the ones that appear to see each other and note the gaps. Nine times out of ten, the gaps are where terrain blocks the view or where the coast turns. Now compare your sketch with an old chart or a topographical map from a hundred years earlier. The chances are the chain is denser there, and the extra towers sit exactly where your gaps are.
That is the whole discipline in miniature. Towers were mapped because they were useful, and they remain useful to a reader who asks the right questions of them: what was this watching, what was it signalling to, and who needed to find it. Answer those, and the symbol stops being a small piece of decoration on the sheet and becomes a working piece of the landscape again.