
A hiker at a trailhead may hold two maps of the same national park. One fits the whole park on a single sheet; the other covers a single valley but shows every stream, fence line, and contour. The first is usually called a small-scale map, the second a large-scale map. That language trips up nearly everyone. It sounds as though the large-scale map should show more ground, but it does the opposite: it shows less ground with more detail. Once you treat scale as a ratio rather than a measure of importance, the labels stop fighting your instincts.
The confusion is not just a beginner’s problem. Experienced travelers, planners, and students all pause when a map’s scale is described as “large” or “small,” because the words seem to describe the size of the map rather than the size of the fraction. A wall map of the world can be physically enormous and still be small-scale. A folded city map can be tiny and still be large-scale. The key is to ask what the map is doing to the ground: is it magnifying a small area, or compressing a large one?
What Map Scale Actually Means
Map scale is the relationship between distance on the map and the same distance on the ground. It appears in three common forms, and all of them express the same ratio:
- Representative fraction: 1:25,000 means one unit on the map represents 25,000 of the same units on the ground. In metric, one centimetre equals 25,000 centimetres, or 250 metres. In imperial, one inch equals 25,000 inches, roughly 0.4 miles.
- Verbal scale: “1 cm to 250 m” or “one inch to the mile.” Clear, but tied to the units named. A verbal scale is convenient for readers who think in one measurement system, but it can become awkward when a map is reproduced or viewed by an international audience.
- Graphic bar scale: a line marked with distances. It remains useful if the map is enlarged or reduced on a screen or photocopier, because the bar changes with the image. If the whole map grows by ten percent, the bar grows by ten percent too, so the relationship stays visible to the reader.
The number after the colon is the denominator, and it is the part that matters most. A map at 1:10,000 has a smaller denominator than a map at 1:100,000, which makes its fraction larger. That is why cartographers call 1:10,000 a larger scale. The label describes the ratio, not the amount of land on the sheet. In other words, 1/10,000 is a bigger fraction than 1/100,000, so the map at 1:10,000 is the “larger-scale” map even though it covers far less ground.
It helps to remember that a representative fraction is unitless. The “1” and the “25,000” are not inches, centimetres, or miles by themselves; they become those units only when you apply them. That is why the same fraction works in any measurement system. It also explains why a scale bar is so practical: it translates an abstract ratio into a visual distance that survives changes in screen size, printing size, and viewing distance.
Why the Labels Feel Backwards
The confusion comes from everyday language. A “large map” usually means a big sheet of paper, and a “small map” means a pocket-sized one. Map scale does not work that way. A large-scale map magnifies a small patch of ground. A small-scale map compresses a large region. A city street map at 1:10,000 is large-scale even if it fits in a glove box; a world map at 1:50,000,000 is small-scale even if it fills a wall.
People also say “scale up” when they mean “enlarge the image.” That is a different operation. Blowing up a 1:100,000 map on a photocopier makes the lines bigger, but it does not turn the map into a 1:50,000 map. The original scale is still 1:100,000, and the detail is still that of a 1:100,000 map. The bar scale may grow with the copy, but the information cannot improve. A blurred contour line does not become a surveyed hillside simply because it has been printed larger.
Scale is a ratio, not a ranking. A large-scale map is not “better” than a small-scale map; it simply answers a different question.
This distinction matters when maps are used for decisions. A small-scale map might be perfect for understanding a regional watershed or a long-distance route. A large-scale map might be necessary for finding a property boundary, a trail junction, or a safe place to cross a river. Using a small-scale map for a local task is like using a highway atlas to locate a garden gate: the information may be broadly correct, but it is not detailed enough for the job.
Large-Scale vs. Small-Scale Maps Compared
There is no universal cutoff between large and small scale, because the terms are relative. A map at 1:250,000 is large-scale compared with a world map, but small-scale compared with a city plan at 1:5,000. Still, cartographers often use rough ranges as shorthand. Large-scale maps are commonly 1:10,000 or larger; medium-scale maps fall somewhere between 1:10,000 and 1:100,000; small-scale maps are often 1:100,000 or smaller. These boundaries vary by country and by map series, so the safest approach is to compare the fractions directly.
- A property or engineering plan at 1:5,000: very large-scale. It may show individual buildings, fences, paths, and utility lines. One centimetre on the map represents 50 metres on the ground.
- A topographic map at 1:24,000: large-scale. It is detailed enough for hiking, field survey, and local landform study. One inch represents 24,000 inches, or about 0.38 miles.
- A regional road map at 1:250,000: small-scale in everyday use. One centimetre represents 2.5 kilometres. Towns appear as symbols, and many minor roads are omitted.
- A national map at 1:1,000,000: small-scale. One centimetre represents 10 kilometres. The map is useful for regional patterns, not street navigation.
- A world map at 1:50,000,000: very small-scale. One centimetre represents 500 kilometres. Continents and oceans dominate; local detail disappears entirely.
The comparison becomes clearer when you imagine the same town shown at three scales. At 1:5,000, you might see individual houses, gardens, and footpaths. At 1:50,000, the town becomes a cluster of streets and a few landmark symbols. At 1:500,000, the town may be reduced to a dot or a small shaded area. The ground has not changed; the map’s purpose and scale have.
How Scale Changes What a Map Can Show
Scale affects far more than the size of the printed features. It controls how much information can be included, how that information is generalized, and how precisely a reader can measure distance or locate a feature. A large-scale map has room for detail, so it can show individual buildings, small streams, field boundaries, and tightly spaced contour lines. A small-scale map must simplify, because it is squeezing a large area into a small space.
Cartographers call this simplification generalization. On a small-scale map, a river may be drawn wider than its true width so that it remains visible. A winding road may be straightened slightly. Minor roads, tiny settlements, and short trails may be left out altogether. Contour intervals may become larger, so the map shows broad changes in elevation rather than every small hill. None of this is a mistake; it is a necessary compromise. A map that tried to show every feature at a small scale would become unreadable.
Large-scale maps also tend to support more precise measurement. If you need to calculate the length of a footpath, the area of a parcel, or the distance between two buildings, a large-scale map gives you a better chance of doing so accurately. On a small-scale map, a millimetre of line width can represent a wide strip of ground, and small features may be represented by symbols that are larger than the features themselves. The scale tells you how much confidence to place in a measurement.
Reading Scale in Practice
To use scale well, follow a simple routine:
- Find the scale statement. Look for a representative fraction, a verbal scale, or a bar scale. If more than one appears, check that they agree.
- Identify the units. A fraction such as 1:25,000 is unitless, but a verbal scale may name centimetres, inches, metres, or miles. Convert to the units you find easiest to use.
- Measure with the bar scale when possible. A bar scale is especially helpful on screens, photocopies, and printed maps that may have been resized.
- Multiply, then convert. If the map distance is 3 centimetres at 1:25,000, the ground distance is 3 × 25,000 = 75,000 centimetres, or 750 metres. If the map distance is 4 centimetres at 1:50,000, the ground distance is 200,000 centimetres, or 2 kilometres.
- Ask whether the map is detailed enough. A scale can be mathematically correct and still be unsuitable for your task if the features you need have been generalized away.
Here is a quick comparison that shows how much difference the denominator makes. At 1:10,000, one centimetre represents 100 metres. At 1:50,000, one centimetre represents 500 metres. At 1:250,000, one centimetre represents 2.5 kilometres. At 1:1,000,000, one centimetre represents 10 kilometres. The same ruler, the same hand, and the same map-reading skill produce very different results depending on the scale.
Choosing the Right Scale for the Job
Use a large-scale map when the task is local and precision matters. Hiking with a detailed topographic map, planning a property boundary, locating a building, studying a small watershed, or navigating a dense city all call for large-scale information. Use a small-scale map when the task is broad and pattern-oriented. Planning a long road trip, understanding a regional climate pattern, comparing mountain ranges across a continent, or seeing how a river system connects across a country may be easier with a small-scale map.
Digital maps add a useful twist. On a phone or computer, you can zoom in and out, and the scale bar often updates as you do. But zooming is not the same as gaining new detail. If the underlying data were collected at a small scale, zooming in may only enlarge generalized shapes and symbols. The map may look larger on the screen without becoming more informative. Always check the scale bar and, when the map provides it, the source and resolution of the data behind the view.
Once you read scale as a ratio, the labels become practical rather than paradoxical. A large-scale map gives you a close, detailed view of a small area. A small-scale map gives you a broad, simplified view of a large area. Neither is more important than the other. The right map is the one whose scale matches the question you are asking.
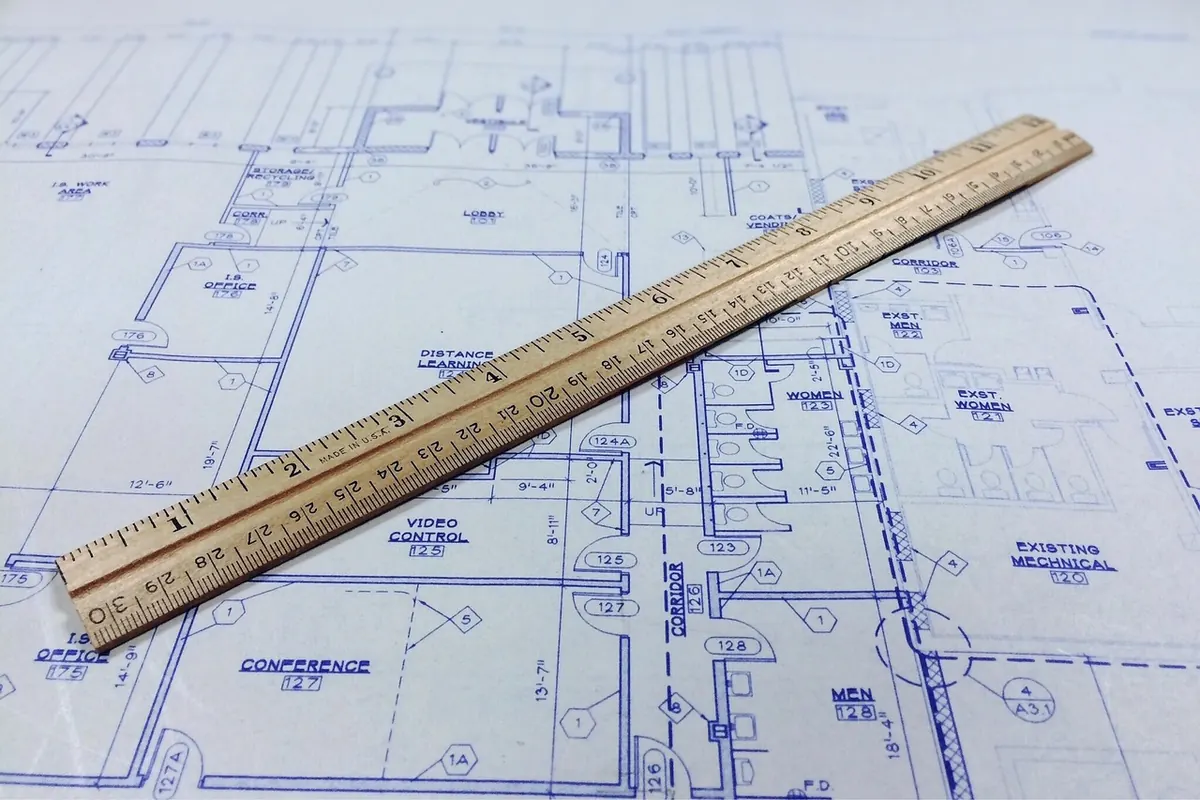
Photo: WOKANDAPIX / Pixabay